“The rise has gone on for so long that in a sense it has trapped investment managers worldwide. If they are out of a market rising like this one they fall behind in the performance race. Results in this race are measured over months, and many of those running have only themselves to blame if they are timed for a sprint when in reality they are running a marathon.” – Victor Wood, May 1987
This is a financial promotion issued by McInroy & Wood Limited (‘McInroy & Wood’), regulated by the Financial Conduct Authority. McInroy & Wood is the Investment Adviser to the McInroy & Wood Balanced Fund referred to in this article. Please note that historic performance is not a guide to or guarantee of future returns. The value of investments and the income they generate can fluctuate and may go down as well as up.
The global equity market has delivered extraordinary returns over the past decade. Much of this performance has been driven by the United States and, particularly in recent years, a small group of very large technology companies with exposure to artificial intelligence (AI). So impressive is their rise that global equity benchmarks are today their most concentrated since the 1970s, with this handful of mega-cap companies now constituting a disproportionate share of the market.
Investors in passive strategies that track index performance have benefitted, but how many know what has driven their returns to date? And more importantly, how many are aware of what history tells us about the risks associated with highly concentrated, expensive markets?
Chart 1. The ‘Magnificent 7’ stocks now account for a higher share of the global stock market than the seven largest countries after the US
Weight in MSCI ACWI, %
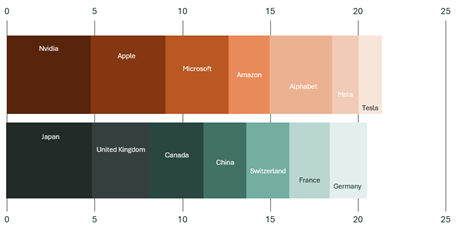
Source: MSCI, Bloomberg. Date: 31 December 2025.
New technologies create excitement. In many cases, this is justifiable. Railways transformed how people and goods were transported, fostering trade and boosting tourism. The internet revolutionised communication and access to information, changing how people work, learn and interact across the world. AI has similar potential. An often-made argument is that it will lead to dramatic progress in areas such as drug development, education and engineering, catalysing a step-change in productivity and innovation that accelerates economic growth. Some technologists see generative AI as an important step on the way to a "robo-economy", where AI systems handle the majority of manufacturing, logistics and administrative tasks, leaving humans to plan, oversee and consume AI’s outputs.
On that basis the investor enthusiasm directed towards the theme of AI seems deserved. Similar excitement existed during the railway boom and dotcom era, both periods where stock market concentration spiked. Failing to capture the gains associated with the next technological revolution would be deeply uncomfortable for most investors, and terminal for some.
This fear of missing out, or ‘FOMO’, has undoubtedly contributed to the sharp rise in fund flows into the US stock market in recent years, with investors desperate to gain exposure to a market endowed with companies at the leading-edge of developments. Passive investment funds have accelerated this attraction of capital. A low-cost and convenient way for institutional and retail investors to access the market, their rise in popularity has been monumental. From a negligible share at the beginning of the 1990s, passive strategies now account for a higher share of US equity fund assets than active strategies.
Chart 2. Passive’s popularity has accelerated over the last decade, with AUM now above that of actively managed strategies
Global flow of funds ($bn) Share of Total US Equity Fund Assets (%)
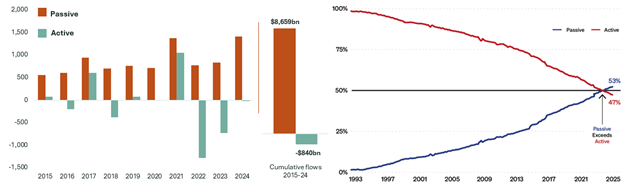
Source: Morningstar, Fundsmith (Feb 2026)
This matters for valuations. Market prices are the result of transactions between buyers and sellers. If enough investors believe a stock to be undervalued, theory argues that the collective act of buying should drive the share price to reflect its intrinsic value. Similarly, collective selling corrects the share prices of overvalued companies. The rise of passive investment means that a higher proportion of investors are now basing decisions not on an assessment of a company’s underlying intrinsic value but on how much of a given index it represents. The upshot is that market prices have the potential to deviate from their intrinsic value for longer and by a larger margin which, in turn, has implications for future investment returns. We believe that this is the situation we find ourselves in today.
Stock prices can rise if (a) a business becomes more profitable, or (b) investors become willing to pay more for the same level of profits. The former reflects actual improvement in the company’s performance, while the latter reflects investors’ expectations that profits will grow in the future. For every ten-year period since 1876, the chart below decomposes the total return of the US stock market into these two elements. Component (a) is represented by earnings growth while component (b) is represented by valuation growth.
Chart 3. Last decade’s returns were driven by above-average valuation growth
Decomposition of US stock market total returns over every ten-year period since 1886
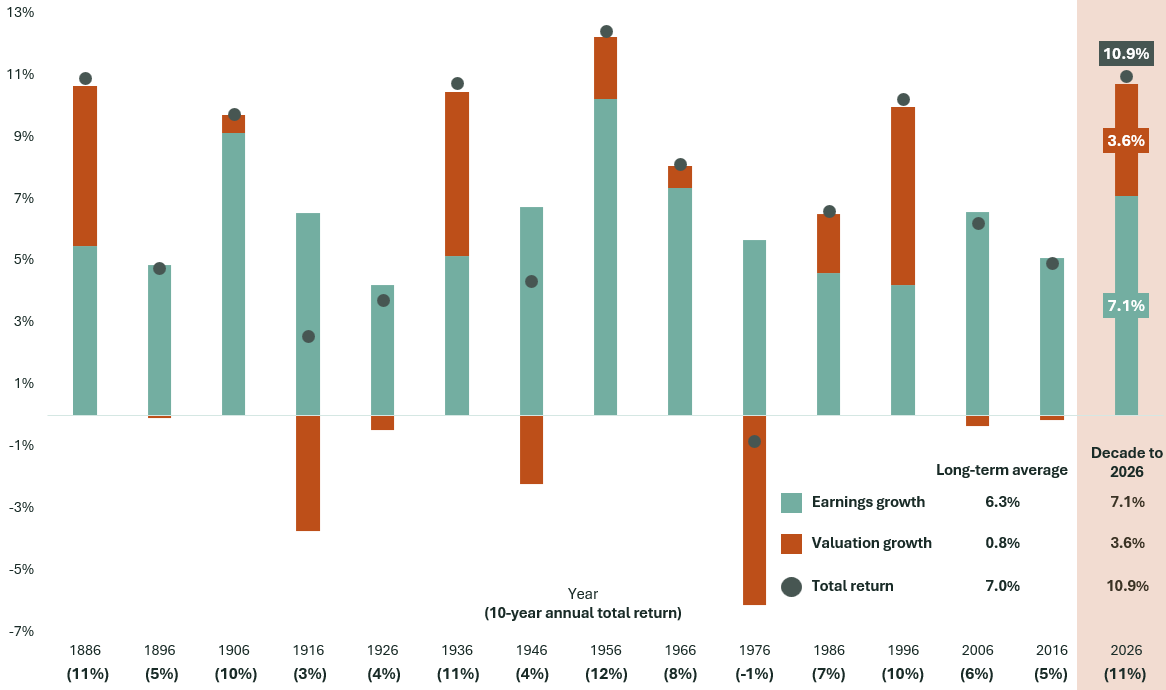
Source: Shillerdata.com. Date: 31 March 2026.
Chart 3 shows that over the long term, the earnings growth of the US stock market has averaged 6.3 percent per year. This growth rate has always been positive and, excluding two outliers, has been remarkably consistent across decades. The 7.1 percent growth rate seen over the most recent period, while marginally higher than the long-run average, was by no means exceptional by historic standards. Despite this, the total return over the same decade was the second highest on record. The explanation for this is that component (b) of the total return, here measured by the change in the cyclically adjusted price-earnings (CAPE) ratio[1], was exceptional by historic standards, contributing nearly 4 percent per year - more than four times the long-run average.
Thus, while the relatively stable component (a), earnings growth, has historically been the principal driver of stock market returns, the extraordinary total returns seen over the last decade were driven largely by the far more volatile and often negative component (b): valuation growth.
This matters because, as shown by Chart 3, valuation growth of the magnitude seen over the last ten years is rarely repeated in consecutive periods. Indeed, indicators such as the CAPE ratio, whose March reading of 40x was one of the highest on record, show strong evidence of mean reversion: periods of excessive optimism and pessimism are typically followed by a resetting of market expectations. This process can be painful for investors.
With recent growth in component (b) closely tied to AI enthusiasm, investors should be mindful of their exposure to a technology which may prove transformative, but which is also highly vulnerable to a sharp swing in sentiment should growth forecasts be reassessed. Indeed, evidence from previous technological revolutions suggests that even the most successful innovations are fraught with investment risk.
This is not to say that McInroy & Wood does not seek exposure to companies that would benefit from adoption of, and continued investment into, AI. Our preference is merely to invest in businesses whose future earnings are not solely dependent on such an outcome. This means identifying companies that are exposed to a broader range of end markets and operate at levels of the supply chain that are less vulnerable to the fierce competition of consumer-facing AI. While share prices fluctuate based on the changing mood of markets, consistent earnings growth ultimately drives long-term returns. Our belief is that accessing the theme of AI in this way provides greater visibility on future growth in profits.
At the same time as prioritising company fundamentals, our investment process also emphasises a disciplined approach to valuation. By limiting exposure to companies trading at elevated prices, we aim to mitigate the risk of being caught on the wrong side of mean reversion in valuations.
Chart 4 illustrates how this is approach is reflected in the holdings of the MW Balanced Fund. Each green bar represents the average annual earnings growth of Balanced Fund companies, split by geography, over the past three years. The orange dots represent valuations relative to historic averages for those same geographies. An orange dot above the line indicates that companies in that region are, on average, more expensive than history, while dots below indicate they are cheaper.
Over the past three years, Balanced Fund companies on the whole have grown earnings at an average rate of 10 percent per year. Under normal market conditions, such strong fundamental performance would typically be reflected in share price returns. However, against a backdrop of AI enthusiasm and the associated flow of capital to the US from other markets, this relationship has not held. The more broadly diversified list of Balanced Fund companies has in fact delivered average share price gains of only 7 percent per year, with valuations now below long-term averages.
Chart 4. Strong underlying performance overlooked in a concentrated market
Valuations and 3-year annual earnings growth of MW Balanced Fund companies by region
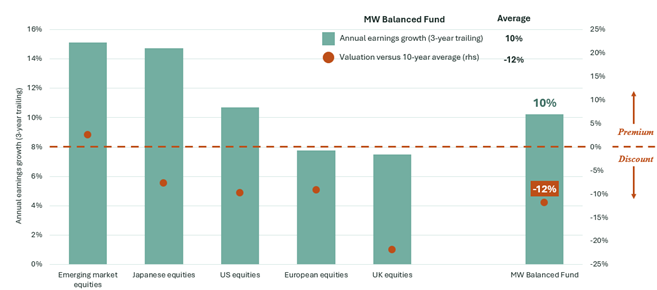
Source: Bloomberg. Date: 31 March 2026
While expectations of future growth have driven the extraordinary market returns of the last decade, our belief is that these returns will eventually broaden as investors grow concerned over high levels of concentration and elevated valuations, and begin to reward reasonably priced companies already delivering strong earnings growth. Whilst investment returns can never be guaranteed, Chart 4 suggests that the Balanced Fund would be well positioned for this eventuality.
There are signs that the momentum is already shifting. Last year, the US stock market was among the worst performing globally, with Europe, the UK, Japan and emerging markets all registering stronger gains. To the end of the first quarter of 2026, the equal-weighted US index recorded its strongest performance relative to the conventional size-weighted index in decades. Over the last six months, indices tracking the performance of value, small-cap and high-yielding stocks have all significantly outperformed the Magnificent 7. We recognise that our approach to investment has been out of favour in recent years, although this evidence all points to a market that is now more willing to ascribe value to strong fundamentals, regardless of sector or geography.
The quotation at the top of this article was written in May 1987 by Victor Wood, our firm’s co-founder, near the end of a 13-year bull market in equities. Some forty years later, Victor’s caution over rising valuations and the relentless ability of markets to shrug off new risks remains just as relevant. In a market characterised by extremes, focusing on company fundamentals and maintaining a disciplined approach to valuation are the only reliable tools to manage risk. These have always been the guiding principles of McInroy & Wood’s investment process and have served our clients well for multiple decades. We believe they are more important today than ever.
[1] A widely used valuation measure that compares the market price to ten-year average, inflation-adjusted earnings. A higher ratio indicates that the market is willing to pay more for each dollar of profit at a given time.
Nothing in this article should be deemed to constitute the provision of financial, investment or other professional advice in any way. This article reflects McInroy & Wood’s opinions at the date of publication only, the opinions are subject to change without notice, and McInroy & Wood shall bear no liability for any loss arising from reliance on them.
A particularly challenging client group for investment managers and advisers
The global economy entered 2026 in a relatively strong position, but the Middle East conflict quickly reshaped the outlook, disrupting oil and gas supplies and triggering an energy shock. Yet while the near-term effects are significant, the more important theme is structural.
Excitement over AI has been a key driver of strong stock market returns over the last decade. This has benefitted the passive funds that track their performance, while active managers have had a more challenging period. Does focusing on the fundamentals still work in today's market, or is it different this time?